Thermal Expansion Wave VDUB_v1TEW_V1
*** Modified, Madrid Ma Ribbon, Mashup. Using three colours indicating thermal expansion zones using Hull ma for the pivot points.
Buscar en scripts para "pivot points"
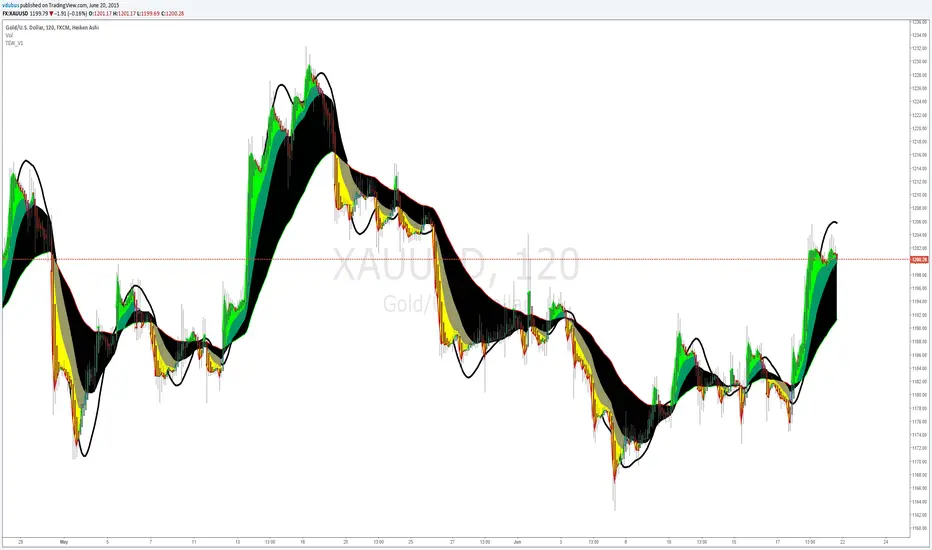
vdubongCustom script I fabricated which I use for Binary Trading on the 1m & 3m charts together with Price action & Time management but the principles are the same for all mediums. Use Price action buy/sell in the clear zones. Use the outer 'pink' horizontal lines (highs / lows / pivots points) to place SL's.
I personally run an additional BB 50/2 for clearer BB higher highs & lower low perspective, but it's not part of the script. Script variables are fully customisable.
I don't take ownership of any part of the script, I not a programmer /script writer just a dabbler. Enjoy :) - VDUBONG UPDATED

Aivance Opening Range & Vol FactorAivance Opening Range & Volume Factor
Overview
The Aivance Opening Range & Volume Factor is a comprehensive tool designed for Day Traders and Scalpers who rely on the "Opening Drive" or "Opening Range Breakout" (ORB) strategies.
The first candle of the trading session often sets the tone for the entire day. This indicator not only visualizes the price action of that critical first candle but also contextualizes the Volume to help you determine if there is enough institutional participation to sustain a trend.
Key Features
1. Opening Volume Factor
Unlike standard volume indicators, this tool calculates a specific Volume Factor for the opening candle:
Formula: (Volume of 1st Candle / Total Volume of Previous Day) * 100
Why it matters: A high Volume Factor (thresholds vary significantly depending on the chart timeframe and asset) suggests strong institutional interest immediately at the open. This often increases the probability of a sustained trend day rather than a choppy range day.
2. Automatic Session Detection
No manual time inputs are required.
The indicator uses time("D") to automatically detect the start of the trading day.
RTH vs. ETH: It adapts to your chart settings. If you use "Regular Trading Hours" (RTH), it marks the 09:30 NY open. If you use "Extended Trading Hours" (ETH), it marks the pre-market open.
3. Visual Opening Range
Box & Lines: Draws a box highlighting the High/Low and the Body (Open/Close) of the opening candle.
Extension: Extends support/resistance lines across the session to help identify breakouts or retests of the opening range later in the day.
4. Smart "Pullback" Logic (Optional)
This script includes a unique filter called "Show only on Pullback":
Default (False): The range is drawn immediately when the first candle closes.
Enabled (True): The range is hidden until the market prints a candle in the opposite direction of the opening move.
Strategy: This helps filter out impulsive moves and encourages trading the "retest" or the failure of the initial drive, rather than chasing the first tick.
How to Use
Trend Confirmation: Look for a breakout of the Opening Box combined with a high Volume Factor.
Support/Resistance: Use the extended gray lines (High/Low of the first candle) as key pivot points for stop-losses or entry targets.
Context: Compare the Volume Factor across different days to establish a baseline for your specific asset (e.g., what constitutes "High Volume" for NQ vs. ES vs. AAPL).
Settings
Colors: Fully customizable colors for Long (Bullish) and Short (Bearish) opening ranges.
Volume Factor: Toggle the text label on/off and adjust size/color.
Logic: Toggle the "Pullback" requirement on/off.
Disclaimer: This tool is for informational purposes only and does not constitute financial advice. Always manage your risk.

Target Lock Algo buy and Sell Signal by Amit NamdeoTarget Lock Algo: Professional Buy & Sell Signals
Target Lock Algo is a comprehensive, institutional-grade trading system designed to filter out market noise and provide high-probability entry signals with automated risk management. It combines Trend Flow, Market Structure (SMC), and Volatility Analysis into a single, clean interface.
Key Features
1. Precision Signal Engine
Trend-Following Logic: The core algorithm uses a smoothed Baseline to detect the dominant market flow. Signals are generated only when the trend flips (Green for Bullish, Red for Bearish).
"One-Shot" Execution: To prevent overtrading, the system never issues consecutive signals in the same direction. It forces a complete trend reversal before signaling again.
Whipsaw Protection: A built-in time filter (Min Bars) prevents signals from clustering together during choppy price action.
2. Institutional Filters (The "Safety Net")
200 EMA Major Trend Filter:
Buys are only enabled when price is ABOVE the 200 EMA.
Sells are only enabled when price is BELOW the 200 EMA.
This prevents catching falling knives or buying into a crash.
ADX Chop Filter:
The system actively monitors market strength using the Average Directional Index (ADX).
If the market enters a sideways "Chop Zone" (ADX < 20), all trading signals are hard-blocked.
Visual Aid: These zones can be highlighted with Gray Boxes to warn you to stay out.
3. Automated Risk Management (Target Lock)
When a signal is generated, the algorithm automatically calculates and draws the exact trade parameters on your chart:
⚡ ENTRY: The precise closing price of the signal candle.
🛑 STOP LOSS: Dynamic stop loss calculated using Market Volatility (ATR). If the market is volatile, the stop widens; if calm, it tightens.
🎯 TP 1, 💰 TP 2, 🚀 TP 3: Three take-profit levels calculated based on strict Risk-to-Reward ratios (1.5R, 2.5R, and 3.5R).
4. Premium Visual Interface
Glassmorphism Dashboard: A modern, transparent HUD in the top-right corner displays real-time data:
Current Trend: (Bullish 🟢 / Bearish 🔴)
Market State: (Active 🔥 / Ranging 💤)
Volatility: (Live ATR value)
SMC Overlay: Subtly plots pivot points and market structure breaks in the background to give you institutional context without cluttering the signals.
High-Contrast Design: Signals appear as modern "Neon Buttons," while TP/SL lines use rich, deep colors (Deep Emerald & Crimson) for professional visibility.
How to Trade with Target Lock Algo
Check the Dashboard: Ensure the Market State says "ACTIVE 🔥". If it says "RANGE 💤", be cautious.
Wait for the Button: Look for the "BUY NOW" (Neon Green) or "SELL NOW" (Neon Red) label.
Verify the Trend:
For BUY: Price should be above the white 200 EMA line.
For SELL: Price should be below the white 200 EMA line.
Execute: Enter the trade at the ⚡ ENTRY price.
Manage: Set your Stop Loss at the 🛑 SL line and take partial profits at TP 1 and TP 2. Leave a "runner" for TP 3 if the trend is strong.

Multiple indicator for futures in scalping"Multiple indicator with:
EMA 8, 20, 50, 100, 200
Bollinger Bands
Daily, weekly, and monthly OHLC
Fibonacci pivot points R1R2R3/S1S2S3
VWAP
It works very well for futures, to see where to enter and exit, and to get positioned. I mostly use it on the Nasdaq and DAX, where the price constantly bounces in the areas marked by this indicator. It’s only for scalping, ideal on a 1-minute chart."

20SMA Reversal - Peak/Trough TrendlinesTitle: 20SMA Reversal with Peak/Trough Trendlines
Description (English): This indicator detects pivot points where the 20-period SMA reverses direction (forming a V-shape or an Arch-shape). Upon detection, it automatically identifies the local peak/trough from a lookback period and connects them with an extended trendline if they show a "Lower High" or "Higher Low" pattern. Useful for identifying trend structural changes and potential breakout levels.
概要(日本語): このインジケーターは、20期間SMAが反転(V字回復や山なり反転)するポイントを検出します。反転確定時に、指定した遡り期間内の高値・安値を自動的に特定し、それらが「高値切り下がり」または「安値切り上がり」の条件を満たす場合に、右側に延長されたトレンドラインを描画します。トレンドの構造変化やブレイクアウトの目安として活用いただけます。

Liquidity Sweep of Candle & Swing @MaxMaserati 3.0MMM Liquidity Sweep Detector for single candle sweep and/or Swing Sweep
Identify liquidity sweeps with precision. A sweep occurs when price wicks through a key level (previous candle high/low or swing point) but closes back inside the range - indicating a failed breakout and potential reversal.
The set includes: Sweep Low, 50% of wick, TGT level
KEY FEATURES:
- Two Detection Modes: Track sweeps on previous candle levels OR swing highs/lows (pivot points)
- Both Mode: View candle and swing sweeps simultaneously
- Visual Clarity: Each sweep displays three extending lines (SWH/SWL, Target, 50% wick), box zone, and swept level with red X marker
- Smart Updates: When price creates new sweep levels without hitting targets, the entire sweep structure automatically relocates to the new level
- Double-Sided Logic: When both sides are swept on one candle, the indicator intelligently places the sweep on the longest wick side
SWEEP DEFINITION:
Bullish Sweep: Price wicks BELOW a low but closes ABOVE it (back inside range)
Bearish Sweep: Price wicks ABOVE a high but closes BELOW it (back inside range)
The indicator only creates sweeps on unviolated levels - levels that haven't been closed through yet. This ensures you're trading genuine liquidity sweeps, not broken levels.
CUSTOMIZATION:
- Adjustable swing lookback period
- Multiple box placement options
- Full color and display controls
- Invalidation options (Sweep High/Low or 50% Wick)
- Statistics panel showing active sweeps and completion rates
Perfect for traders using ICT concepts, Smart Money Theory, or institutional order flow analysis. Identify where large players are hunting liquidity before reversing price.
⚠️ DISCLAIMER
Educational Tool Only - This indicator is for educational and informational purposes only and does not constitute financial, investment, or trading advice.
Risk Warning - Trading involves substantial risk of loss and is not suitable for all investors. Past performance does not guarantee future results. No representation is made that this indicator will achieve profits or prevent losses.
User Responsibility - All trading decisions are solely your responsibility. The developer and Max Maserati Model assume no liability for losses incurred from using this indicator. Conduct your own research and consult a qualified financial advisor before making investment decisions.
By using this indicator, you acknowledge and agree to these terms.

Liquidity Sweep Pro [Whale Edition]Liquidity Sweep Pro is a next-generation trading tool that bridges the gap between Smart Money Concepts (SMC) and Quantitative Volume Analysis.
Traditional "Liquidity Sweep" indicators often generate false signals by marking every wick crossover as a trade setup. This indicator solves that problem by filtering setups through a Quant VSA Engine. It asks not just "Did price sweep a level?" but "Was there institutional money behind this move?"
🔬 How It Works
The indicator operates on three synchronized layers:
1. Market Structure (Liquidity Pools) It automatically identifies key pivot points where retail Stop Losses are likely clustered:
Buy Side Liquidity (BSL): Areas above swing highs.
Sell Side Liquidity (SSL): Areas below swing lows.
2. The Quant Engine (Whale Detection) Instead of using simple volume averages, we apply statistical modeling to detect anomalies:
Log-Normal Z-Score: Normalizes volume data to detect statistically significant outliers (Sigma > 2.5). This adapts to market volatility, filtering out noise.
Kaufman Efficiency Ratio (KER): Analyzes the quality of price movement to classify the "Whale" type:
❄️ Absorption (Iceberg): High Volume + Low Price Movement. Signals a potential reversal.
🚀 Propulsion (Drive): High Volume + High Price Efficiency. Signals an aggressive breakout.
3. The Trigger (Smart Entry) A trade signal is generated ONLY when:
Price sweeps a liquidity level (wicking below/above).
Price closes back within the range.
Institutional Activity is confirmed (High Z-Score Volume).
Trend (EMA 200) and Momentum (RSI) filters are aligned.
🛡️ Features
Intrabar Analysis: Uses request.security_lower_tf to analyze the internal volume delta of the candle for maximum precision.
Automated Risk Management: Plots Entry, Take Profit, and Stop Loss levels directly on the chart based on ATR (Average True Range) and your preferred Risk:Reward ratio.
Unified Alerts: Includes a single "ANY SWEEP" alert condition, allowing you to monitor both Long and Short setups with just one TradingView alert.
Visual Classification: Candles with institutional activity are marked with a 🐋 symbol, even if no sweep occurs, helping you read the narrative.
⚙️ Best Settings & Usage
Timeframes: Works best on 15m, 1h, and 4h charts.
LTF Interval (Input): This is crucial.
If trading on the 1h chart, set LTF to 1 minute.
If trading on the 4h chart, set LTF to 5 minutes.
Whale Threshold: Default is 2.5 Sigma. Increase to 3.0 for fewer, higher-confidence signals, or decrease to 2.0 for more frequency.
⚠️ Disclaimer
This tool is for educational purposes only. It identifies statistical probabilities, not certainties. Always manage your risk and do not rely solely on one indicator.

ABC Pro Ultimate S/RABC Pro Ultimate is a high-precision trading tool designed to identify harmonic ABC (Zigzag) patterns and combine them with institutional Support & Resistance levels. Unlike standard indicators that clutter your chart with noise, this script filters for high-relevance pivot points from the distant past to provide truly meaningful trade setups.

Multi-Factor Trend Confluence Indicator (PTP V4)Disclaimer: This is a technical analysis tool for educational and informational purposes only. It does not constitute investment advice, financial solicitation, or a recommendation to buy or sell any security or instrument. Trading involves significant risk, and past performance is not indicative of future results. Use at your own risk.
KEY Features and Strategic Methodology
This is a comprehensive trend and confluence indicator built on multiple factors to identify potential pullbacks within an established trend.
• Core Trend Filter: Uses a long-term EMA to confirm the overall market bias.
• Fibonacci Pullback Logic: Identifies potential low-risk entry zones by calculating a 61.8% Fibonacci Retracement over a user-defined lookback period.
• Multi-Factor Confluence: A signal is generated only when the price touches the Fib zone AND the following factors align (You can edit the script to adjust the confluence conditions.):
o RSI is above 50.
o Positive DI is above Negative DI (DMI Bullish Crossover).
o Price is above the fast EMA.
• Consecutive Signal Counter: Includes a unique counter that highlights bars where the confluence conditions have been met for a minimum number of consecutive candles (4 by default), aiding in the validation of strong momentum entries.
• Moving Average Visualization: Plots and color-fills 10 WMA, 21 EMA, 42 EMA, and 200 EMA to provide a full market context and visualize momentum shifts.
1. Short-Term Momentum (WMA10 vs. EMA42 Fill)
This fill area highlights immediate price acceleration and momentum shifts:
• Green Fill (Bullish Momentum): WMA10 > EMA42.
• Red Fill (Bearish Momentum): WMA10 < EMA42.
2. Long-Term Market Context (EMA200 vs. EMA42 Fill)
This fill area defines the dominant backdrop of the market, essential for strategic positioning:
• Green Fill (Bullish Context): EMA200 < EMA42.
• Red Fill (Bearish Context): EMA200 > EMA42.
EMA200 Line Coloration
The EMA200 line color itself also provides a visual cue for the long-term context:
• Red Line: When EMA200 > EMA42 (Bearish Context).
• Green Line: When EMA200 < EMA42 (Bullish Context).
Customization
The indicator is highly customizable via the settings menu, allowing users to adjust lengths for EMA, RSI, DMI, Pivot Points, and the specific parameters for the Fibonacci Retracement Strategy (tolerance and candle limits).

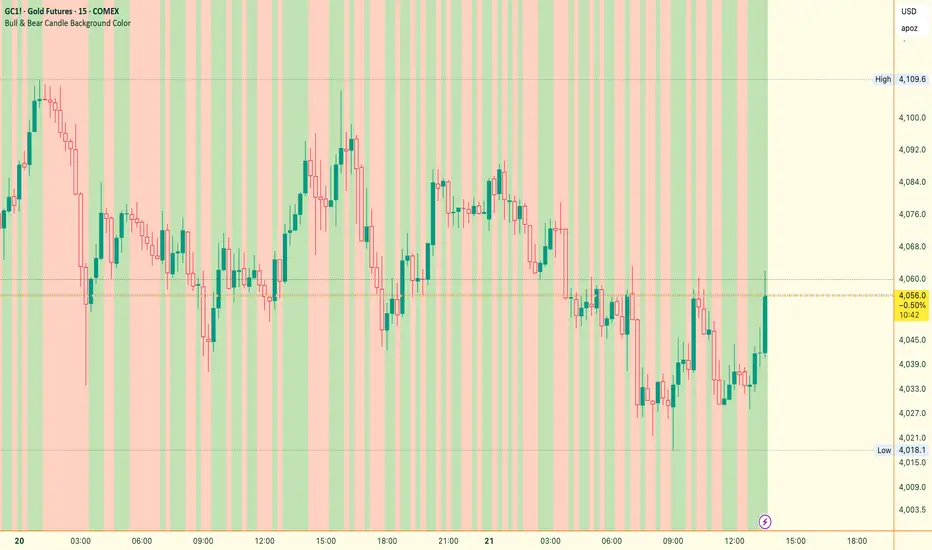
Bull & Bear Candle By Background ColorThe essential chart overlay for high-speed momentum confirmation.
This professional-grade Pine Script v5 indicator provides instant, unfiltered visual feedback on the market's immediate bias by coloring the chart background based on the short-term relationship between Close and Open. It’s designed to streamline decision-making and enhance trade conviction.
Why Traders Use This Tool
In dynamic markets, reading momentum rapidly is critical. This indicator removes visual clutter and cognitive lag.
Zero-Lag Momentum Filter: Instantly identifies if control belongs to buyers (Close > Open) or sellers (Close < Open). A sustained background color acts as a directional bias filter for all your setups.
Trade Confirmation & Conviction: Use the background color as a high-level confluence factor. Only execute Long trades when the background is Bullish and Short trades when it is Bearish. This drastically reduces counter-trend entries.
Risk Management Signal: The appearance of the Neutral/Doji Color flags market equilibrium and consolidation, often preceding a critical structural shift. This is your immediate signal to tighten stops or prepare for a potential reversal setup.
Dual Confirmation: The script offers a highly requested feature: Bar Coloring layered atop the background to provide a second, granular layer of visual context, making momentum shifts impossible to miss.
⚙️ Key Features & Settings Usage
All settings are optimized for clarity, using high transparency to prevent the indicator from obscuring underlying price action or other analytical tools.
🎨 Background Color Settings (Primary)
These controls allow you to define the market state you are reading:
1. Background: Bullish Color: Confirms short-term buying pressure (Close > Open). Set a distinct color for confirmed upward momentum.
2. Background: Bearish Color: Confirms short-term selling pressure (Close < Open). Set a high-contrast color for immediate recognition of downward pressure.
3. Background: Neutral/Doji Color: Signals market indecision (Close ≈ Open). Use as a caution flag, highlighting pivot points and ranging periods.
✨ Added Feature: Bar Coloring
4. FEATURE: Enable Bar Coloring: When enabled, the individual candles are colored with a lighter hue matching the background. This provides dual visual confirmation, maximizing impact on lower timeframes where momentum flips quickly.
🧭 How to Achieve Confluence
Entry Filter: Wait for the background color to flip to your desired direction, then seek your primary entry signal (e.g., breakout, pullback, or MACD cross).
Trade Hold: As long as the background color remains consistent, the short-term momentum is confirmed, justifying the continuation of your trade.
Exit Signal: A flip to the Neutral/Doji Color should be treated as a warning shot, signaling a mandatory review of your position and stops.
Disclaimer: This indicator is a powerful visual and confirmation tool and does not generate buy/sell signals on its own. It is designed to be used in conjunction with your established trading strategy and comprehensive risk management principles
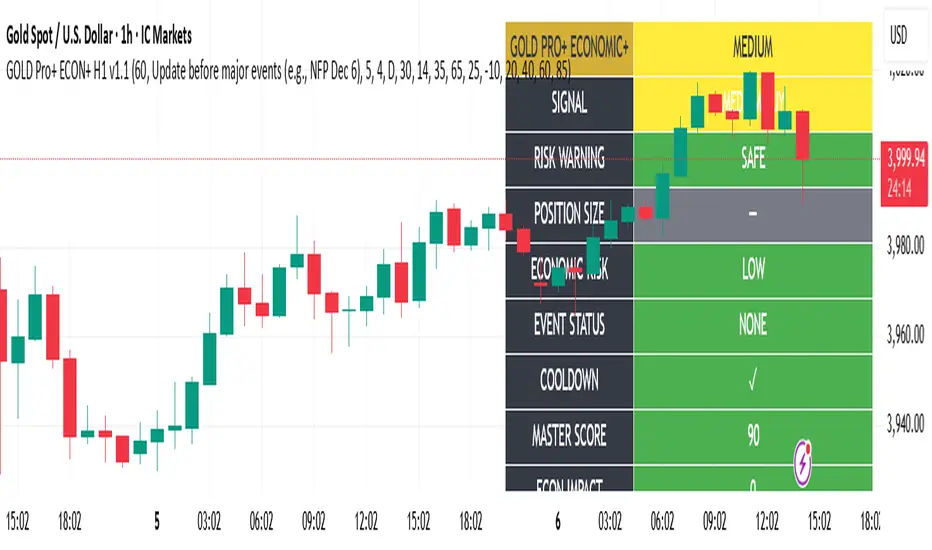
Gold Master Pro Plus ECONOMIC ENHANCED (H1 London v1.1)Overview
This indicator provides gold trading signals with integrated economic calendar awareness, specifically optimized for H1 timeframe and London session trading.
Methodology
The script analyzes multiple technical factors while monitoring economic event risks:
Technical Analysis Components:
RSI for momentum detection with configurable overbought/oversold levels
EMA crossovers (9, 21, 50 periods) for trend direction
MACD for momentum confirmation
ADX for trend strength measurement
Volume analysis for confirmation of price movements
Support/resistance detection using pivot points
Economic Calendar Integration:
Time-based detection of major economic releases (NFP, CPI, FOMC meetings)
Volatility assessment during event periods
USD stability monitoring through currency pair correlations
Automatic cooldown periods after high-impact events
Risk Management Features:
Multi-timeframe confirmation using daily trends
Session-aware scoring (London/NY overlap focus)
Quality-tiered signal classification
Position size recommendations based on signal strength and risk conditions
How to Use
Initial Setup:
Apply to XAUUSD on H1 timeframe
Configure economic settings in the inputs:
Enable economic event filter
Set ET offset (typically 5 hours for winter, 4 for summer)
Select relevant economic events to monitor
Signal Interpretation:
PLATINUM: All conditions aligned (active session, strong volume, low economic risk, trend confirmation)
HIGH: Most factors aligned with moderate risk
MEDIUM: Some factors aligned with acceptable risk
BLOCKED: High economic risk, cooldown period, or manual block active
Dashboard Metrics:
Economic risk level indicates current market safety
Event status shows timing of economic releases
Position size recommends appropriate trade sizing
Master score combines all technical and economic factors
Configuration Options
Economic Settings:
Economic impact threshold (30-80)
ET offset adjustment for timezone accuracy
Cooldown period configuration (2-24 bars)
Technical Settings:
RSI parameters (length, overbought/oversold levels)
Signal thresholds for different quality tiers
Session timing bonuses/penalties
Risk Management:
Multi-timeframe confirmation enable/disable
Higher timeframe selection (D, W, 4H, 12H)
MTF weight percentage (10-50%)
Important Notes
Economic event timing is approximate and should be verified with official economic calendars
Past performance does not guarantee future results
Trading involves substantial risk of loss
This tool is for educational purposes and should not be considered financial advice
The indicator is designed to assist in identifying potential trading opportunities while managing economic event risks through automated protection mechanisms.
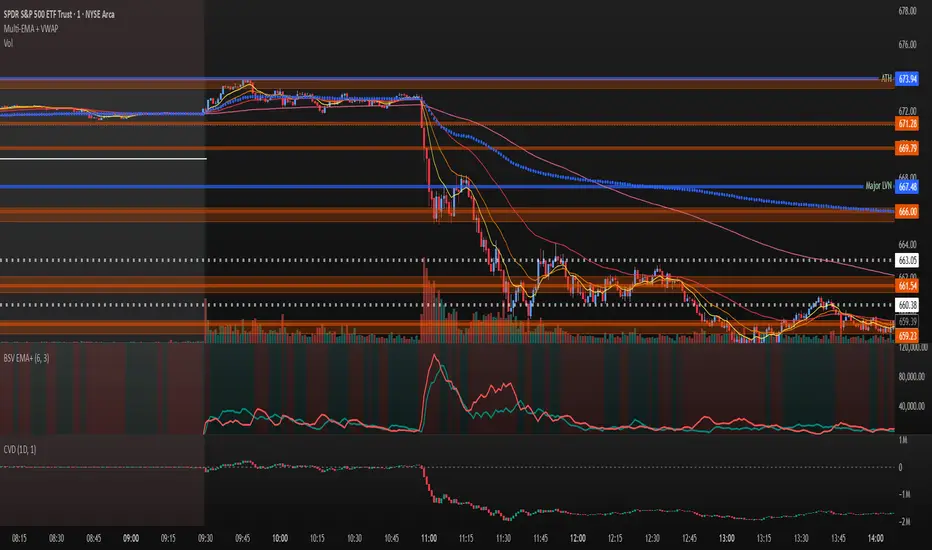
Volume Exponential Moving Averages (EMA)
Description:
This script is a simple script that plots a desired exponential moving average of buy and sell volume as a line chart with a tunable smoothing factor. There is a highlight on the plot area of either green or red to denote if the EMA of buy volume or sell volume is of a higher value. This indicator uses basic math of exponential averages and calculates volume using the formulas: "buy volume" = the product of total volume and the "closing price" minus the "low price" divided by "high price" minus the "low price" for a specific candle. Conversely, "sell volume" = the product of "total volume" and the "high price" minus the "close price" divided by "high price" minus the "low price" for a specific candle.
Utility:
This indicator is an effective way to gauge the acceleration/ deceleration of buyers and sellers in the market and can be used in combination with market structure and important levels to understand if buyers or sellers are taking over at any given time.
How to use this indicator:
There are two settings for this indicator:
1. The Length of the EMA: The length of the EMA can be adjusted based on your preference for a running number of candles' data. If you are interested to know short term changes in volume (e.g. over the past few candles at a major level) you can adjust this setting lower (~3-9 length). Conversely, if you are interested in volume trends over a greater number of candles you can increase this to your liking.
Personal preference : Because I am a short term daytrader/ scalper, I keep this setting at 6 length to see immediate changes in the acceleration or deceleration of buyers/ sellers.
2. The Smoothing Factor: The smoothing factor can be adjusted to further tune the size of trend you are interested in with 1 = No smoothing of the EMA line. Smoothing of the EMA line increases as the value for smoothing increases, resulting in a less volatile, more smooth EMA line. However, the more smooth the line, the less sensitive the EMA will be to immediate changes in volume pace. The less smoothing factor is applied, the more volatile data will be, resulting in quicker observation of shorter term trends. Again the same rules apply as the EMA length as these are similar in function: If you are interested to know short term changes in volume (e.g. over the past few candles at a major level) you can adjust this setting lower (~2-6). Conversely, if you are interested in volume trends over a greater number of candles you can increase this to your liking.
Personal preference : Because I am a short term daytrader/ scalper, I keep this setting at 2-4 smoothing factor to see immediate changes in the acceleration or deceleration of buyers/ sellers.
You should, of course, play with these settings to your exact preferences based on your trading style.
Tips for using this indicator:
General Use:
When the buy volume EMA is moving up, buyers are increasing the pace of buying and when the buy volume EMA is moving down, buyers are decreasing the pace of buying. Conversely, when the sell volume EMA is moving up, sellers are increasing the pace of selling and when the sell volume EMA is moving down, sellers are decreasing the pace of selling. The overall movement of the stock is relative to the combination of these rates. e.g. If both buyers and sellers are increasing at the same rate (EMAs slopes are roughly equal) there will be not a large change in price. If the slope of the buy volume EMA is greater than the slope of sell volume EMA, the price should move up. Conversely, if the slope of the sell volume EMA is greater than the slope of buy volume EMA, the price should move down.
Predicting pullbacks, reversals, and continuations:
This indicator allows you to see if buyers or sellers are increasing their pace, even if the stock price is in consolidation. This allows you to predict if out of the consolidation buyers or sellers are likely to win based on the momentum of the volume in consolidation. e.g. If price is in consolidation after an uptrend and the buy volume EMA starts to decrease, this could be a sign that buyers are running out of steam at this price level. Another example, If at a major support the buy volume EMA begins to trend up then buyers are accelerating the pace of buying at this level.
EMA crosses: There is something to be said about the point at which the buy volume EMA and sell volume EMA cross. This signifies that at this moment there is a shift in which the acceleration of one party outpaces that of the other and can result in increased speed of the movement of the stock price.
Considerations
Because volume changes constantly, this indicator is best to identify short term changes in volume that could impact price movements. It is not guaranteed to continue just because buyers or sellers have had a change in pace. Therefore it is advised to use this indicator in combination with significant price levels such as pivot points, or price levels from volume profile tools to identify the price zones where significant volume changes are likely to impact price movements. It is also advised to continue to monitor the changes in pace in buyers and sellers using this volume EMA indicator to determine if a change in pace is short lived or if it will continue for a longer duration.
Examples of use:
Bullish Reversal:
Bearish Continuation:
Bearish EMA Crossover: (Settings: Length 6, Smoothing factor 3)
Bullish EMA Crossover: (Settings: Length 6, Smoothing factor 4)
Daily/Weekly Wick (Shadow) Range📈 Detailed Guide to the Daily/Weekly Wick (Shadow) Range Indicator
This indicator is a powerful visualization tool designed to map the key price levels established during the previous trading period (either the previous day or the previous week). Instead of just showing a single line for the high and low, it highlights the entire range of the upper and lower wicks (shadows), representing the "battleground" where buyers and sellers were most active.
How It Works
The Wick (Shadow) Range indicator fetches the Open, High, Low, and Close data from the last completed daily or weekly candle and projects those levels onto your current chart. This creates two distinct colored zones.
Upper Wick (Green Zone): This area spans from the Previous High down to the top of the Previous Candle's Body. It visually represents the territory where sellers successfully pushed the price down from its peak. This entire zone can be considered a resistance area.
Lower Wick (Red Zone): This area spans from the bottom of the Previous Candle's Body down to the Previous Low. It shows where buyers stepped in to defend a price level and push it back up. This entire zone can be considered a support area.
How to Use It in Your Trading
This indicator isn't meant to give direct buy or sell signals on its own. Instead, it provides crucial context about market structure. Here are several ways to incorporate it into your strategy:
1. Identifying Key Support & Resistance
This is the indicator's primary function. The most significant levels are:
Key Resistance: The top edge of the green zone (the previous period's high).
Key Support: The bottom edge of the red zone (the previous period's low).
Look for the current price to react when it approaches these boundaries. These are high-probability areas for price to pause or reverse.
2. Watching for Price Rejection (Reversal Trading)
The colored zones are perfect for spotting rejection signals.
Bearish Rejection 📉: If the current price enters the green zone but fails to stay there, closing back below it (often forming a new wick), it's a strong sign that sellers are still in control at that level. This can be an excellent entry signal for a short position.
Bullish Rejection 📈: If the current price dips into the red zone and is quickly bought back up, it shows that buyers are actively defending that area. This can be a great entry signal for a long position.
3. Confirming Breakouts (Trend Trading)
The zones also help validate breakouts.
Bullish Breakout: If the price pushes decisively through the entire green zone and closes above the previous high, it signals that the previous resistance has been broken and the trend may continue upward.
Bearish Breakdown: If the price falls decisively through the entire red zone and closes below the previous low, it confirms that support has failed and the price may continue downward.
4. Setting Context with Timeframes
Weekly Setting: Use the "Weekly" option to identify major, significant support and resistance levels that can influence the market for the entire week. These are powerful levels for swing trading.
Daily Setting: Use the "Daily" option for intraday trading. The previous day's high and low are critical pivot points that many day traders watch.
⚙️ Indicator Settings
The indicator has one simple setting, which you can access by clicking the gear icon ⚙️ next to its name on the chart.
Select Wick Timeframe: This dropdown menu allows you to switch the indicator's calculation between the Daily and Weekly timeframe instantly.

RSI HIGHs and LOWs MarkerThis indicator marks significant RSI (14) pivot points directly on the price chart.
Red markers above candles highlight confirmed RSI highs where the RSI value exceeded 75 (overbought zone).
Green markers below candles highlight confirmed RSI lows where the RSI value dropped below 25 (oversold zone).
These signals help traders quickly identify potential reversal zones and overextended market conditions without having to monitor the RSI window separately.

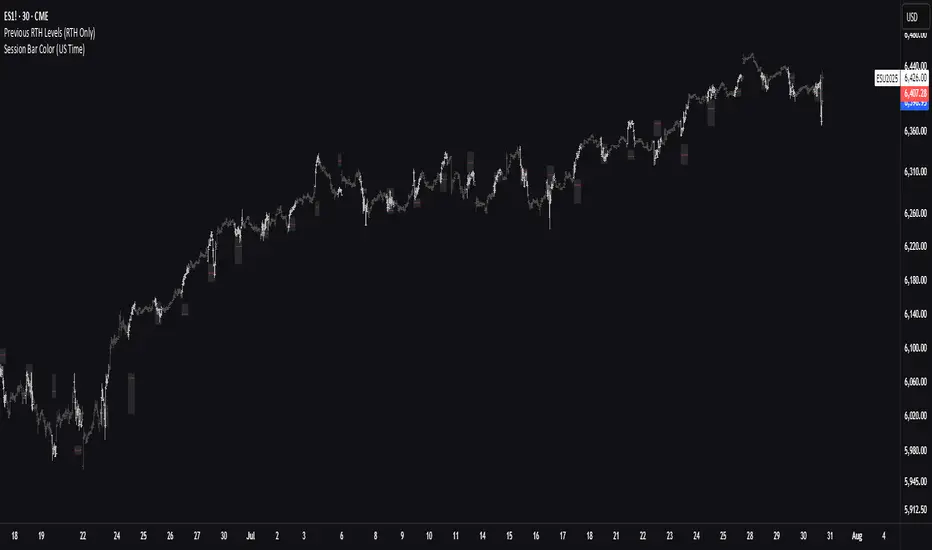
Previous RTH Levels (RTH Only)Previous RTH Levels on current session (RTH Only)
This indicator calculates key volume profile levels from the previous Regular Trading Hours (RTH) session and projects them onto the current RTH session. It is designed to provide traders with significant historical price levels—Point of Control (POC), Value Area High (VAH), and Value Area Low (VAL)—to use as potential support, resistance, and pivot points for intraday trading.
Instead of just plotting lines, this script highlights the entire Value Area (VA) between the VAH and VAL, offering a clear visual reference for the prior day's zone of price agreement.
DoublePatternsDetects Double Top and Double Bottom patterns from pivot points using structural symmetry, valley/peak depth, and extreme validation. Returns a detailed result object including similarity score, target price, and breakout quality.
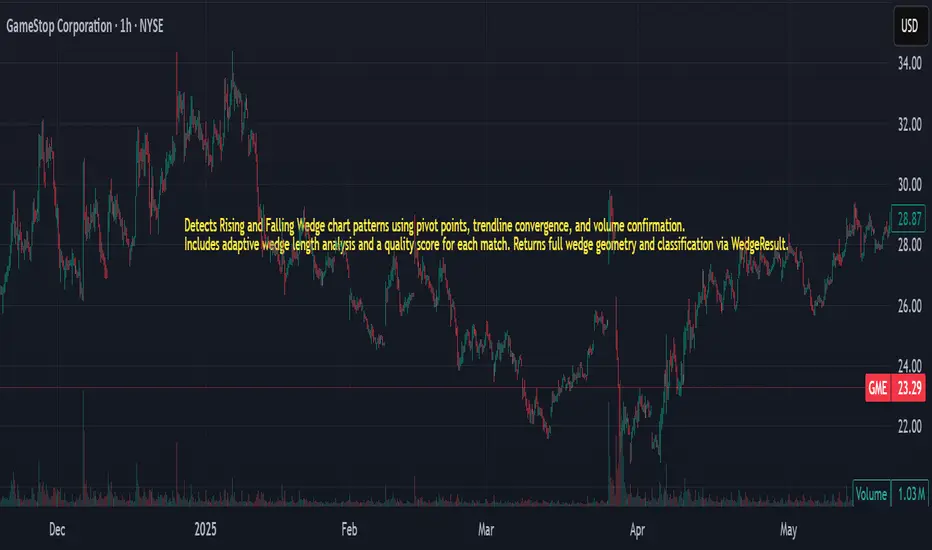
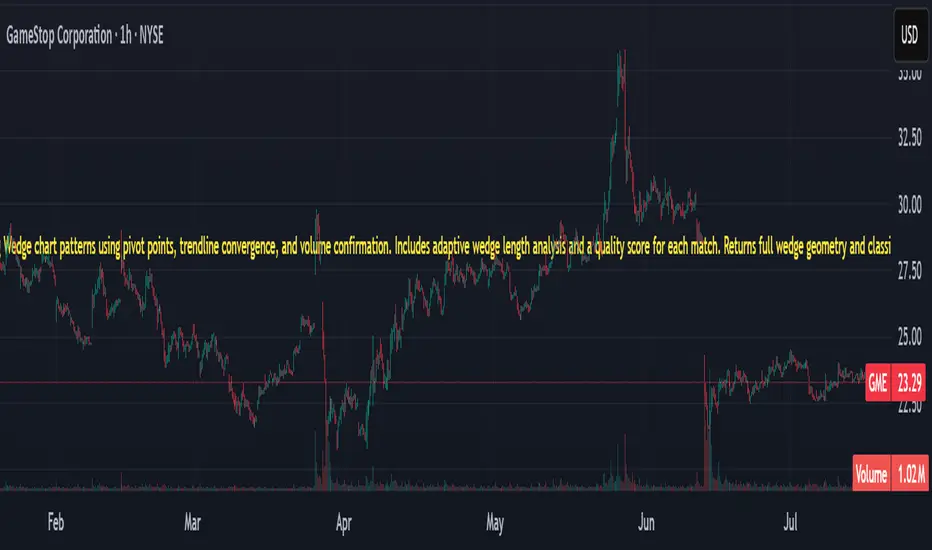
WedgePatternsDetects Rising and Falling Wedge chart patterns using pivot points, trendline convergence, and volume confirmation. Includes adaptive wedge length analysis and a quality score for each match. Returns full wedge geometry and classification via WedgeResult.
All SMAs Bullish/Bearish Screener (Enhanced)All SMAs Bullish/Bearish Screener Enhanced: Uncover High-Conviction Trend Alignments with Confidence
Description:
Are you ready to elevate your trading from mere guesswork to precise, data-driven decisions? The "All SMAs Bullish/Bearish Screener Enhanced" is not just another indicator; it's a sophisticated, yet user-friendly, trend-following powerhouse designed to cut through market noise and pinpoint high-probability trading opportunities. Built on the foundational strength of comprehensive Moving Average confluence and fortified with critical confirmation signals from Momentum, Volume, and Relative Strength, this script empowers you to identify truly robust trends and manage your trades with unparalleled clarity.
The Power of Multi-Factor Confluence: Beyond Simple Averages
In the unpredictable world of financial markets, true strength or weakness is rarely an isolated event. It's the harmonious alignment of multiple technical factors that signals a high-conviction move. While our original "All SMAs Bullish/Bearish Screener" intelligently identified stocks where price was consistently above or below a full spectrum of Simple Moving Averages (5, 10, 20, 50, 100, 200), this Enhanced version takes it a crucial step further.
We've integrated a powerful three-pronged confirmation system to filter out weaker signals and highlight only the most compelling setups:
Momentum (Rate of Change - ROC): A strong trend isn't just about price direction; it's about the speed and intensity of that movement. Positive momentum confirms that buyers are still aggressively pushing price higher (for bullish signals), while negative momentum validates selling pressure (for bearish signals).
Volume: No trend is truly trustworthy without the backing of smart money. Above-average volume accompanying an "All SMAs" alignment signifies strong institutional participation and conviction behind the move. It separates genuine trend starts from speculative whims.
Relative Strength Index (RSI): This versatile oscillator ensures the trend isn't just "there," but that it's developing healthily. We use RSI to confirm a bullish bias (above 50) or a bearish bias (below 50), adding another layer of confidence to the direction.
When the price aligns above ALL six critical SMAs, and is simultaneously confirmed by robust positive momentum, healthy volume, and a bullish RSI bias, you have an exceptionally strong "STRONGLY BULLISH" signal. This confluence often precedes sustained upward moves, signaling prime accumulation phases. Conversely, a "STRONGLY BEARISH" signal, where price is below ALL SMAs with negative momentum, confirming volume, and a bearish RSI bias, indicates powerful distribution and potential for significant downside.
How to Use This Enhanced Screener:
Add to Chart: Go to TradingView's Pine Editor, paste the script, and click "Add to Chart."
Customize Parameters: Fine-tune the lengths of your SMAs, RSI, Momentum, and Volume averages via the indicator's settings. Experiment to find what best suits your trading style and the assets you trade.
Choose Your Timeframe Wisely:
Daily (1D) and 4-Hour (240 min) are highly recommended. These timeframes cut through intraday noise and provide more reliable, actionable signals for swing and position trading.
Shorter timeframes (e.g., 15min, 60min) can be used by advanced day traders for very short-term entries, but be aware of increased volatility and noise.
Visual Confirmation:
Green/Red Triangles: Appear on your chart, indicating confirmed bullish or bearish signals.
Background Color: The chart background will subtly turn lime green for "STRONGLY BULLISH" and red for "STRONGLY BEARISH" conditions.
On-Chart Status Table: A clear table displays the current signal status ("STRONGLY BULLISH/BEARISH," or "SMAs Mixed") for immediate feedback.
Set Up Alerts (Your Primary Screener Tool): This is the game-changer! Create custom alerts on TradingView based on the "Confirmed Bullish Trade" and "Confirmed Bearish Trade" conditions. Receive instant notifications (email, pop-up, mobile) for any stock in your watchlist that meets these stringent criteria. This allows you to scan the entire market effortlessly and act decisively.
Strategic Stop-Loss Placement: The Trader's Lifeline
Even the most robust signals can fail. Protecting your capital is paramount. For this trend-following strategy, your stop-loss should be placed where the underlying trend structure is broken.
For a "STRONGLY BULLISH" Trade: Place your stop-loss just below the most recent significant swing low (higher low). This is the last point where buyers stepped in to support the price. If price breaks below this, your bullish thesis is invalidated.
For a "STRONGLY BEARISH" Trade: Place your stop-loss just above the most recent significant swing high (lower high). If price breaks above this, your bearish thesis is invalidated.
Alternatively, consider placing your stop-loss just below the 20-period SMA (for bullish trades) or above the 20-period SMA (for bearish trades). A significant close beyond this intermediate-term average often indicates a critical shift in momentum. Always ensure your chosen stop-loss adheres to your pre-defined risk per trade (e.g., 1-2% of capital).
Disciplined Profit Booking: Maximizing Gains
Just as important as knowing when you're wrong is knowing when to take profits.
Trailing Stop-Loss: As your trade moves into profit, trail your stop-loss upwards (for longs) or downwards (for shorts). You can trail it using:
Previous Swing Lows/Highs: Move your stop to just below each new higher low (for longs) or just above each new lower high (for shorts).
A Moving Average (e.g., 10-period or 20-period SMA): If price closes below your chosen trailing SMA, exit. This allows you to ride the trend while protecting accumulated profits.
Target Levels: Identify potential resistance levels (for longs) or support levels (for shorts) using pivot points, previous highs/lows, or Fibonacci extensions. Consider taking partial profits at these levels and letting the rest run with a trailing stop.
Loss of Confluence: If the "STRONGLY BULLISH/BEARISH" condition ceases to be met (e.g., RSI crosses below 50, or volume drops significantly), this can be a signal to reduce or exit your position, even if your stop-loss hasn't been hit.
The "All SMAs Bullish/Bearish Screener Enhanced" is your comprehensive partner in navigating the markets. By combining robust trend identification with critical confirmation signals and disciplined risk management, you're equipped to make smarter, more confident trading decisions. Add it to your favorites and unlock a new level of precision in your trading journey!
#PineScript #TradingView #SMA #MovingAverage #TrendFollowing #StockScreener #TechnicalAnalysis #Bullish #Bearish #QQQ #Momentum #Volume #RSI #SPY #TradingStrategy #Enhanced #Signals #Analysis #DayTrading #SwingTrading

LaCrazy Smash CandleLaCrazy Smash Candle highlights powerful engulfing candles that signal potential momentum reversals or breakout continuation.
Smash Long: The candle's low touches or dips below the prior candle's low, then closes above the previous high with a strong body (minimum % of the candle range).
Smash Short: The candle's high touches or exceeds the prior high, then closes below the previous low with a strong body.
These “Smash” moves often occur at key pivot points, signaling decisive rejections or trend continuation. Customize the body strength filter to match your strategy needs.

RSI of RSI Deviation (RoRD)RSI of RSI Deviation (RoRD) - Advanced Momentum Acceleration Analysis
What is RSI of RSI Deviation (RoRD)?
RSI of RSI Deviation (RoRD) is a insightful momentum indicator that transcends traditional oscillator analysis by measuring the acceleration of momentum through sophisticated mathematical layering. By calculating RSI on RSI itself (RSI²) and applying advanced statistical deviation analysis with T3 smoothing, RoRD reveals hidden market dynamics that single-layer indicators miss entirely.
This isn't just another RSI variant—it's a complete reimagining of how we measure and visualize momentum dynamics. Where traditional RSI shows momentum, RoRD shows momentum's rate of change . Where others show static overbought/oversold levels, RoRD reveals statistically significant deviations unique to each market's character.
Theoretical Foundation - The Mathematics of Momentum Acceleration
1. RSI² (RSI of RSI) - The Core Innovation
Traditional RSI measures price momentum. RoRD goes deeper:
Primary RSI (RSI₁) : Standard RSI calculation on price
Secondary RSI (RSI²) : RSI calculated on RSI₁ values
This creates a "momentum of momentum" indicator that leads price action
Mathematical Expression:
RSI₁ = 100 - (100 / (1 + RS₁))
RSI² = 100 - (100 / (1 + RS₂))
Where RS₂ = Average Gain of RSI₁ / Average Loss of RSI₁
2. T3 Smoothing - Lag-Free Response
The T3 Moving Average, developed by Tim Tillson, provides:
Superior smoothing with minimal lag
Adaptive response through volume factor (vFactor)
Noise reduction while preserving signal integrity
T3 Formula:
T3 = c1×e6 + c2×e5 + c3×e4 + c4×e3
Where e1...e6 are cascaded EMAs and c1...c4 are volume-factor-based coefficients
3. Statistical Z-Score Deviation
RoRD employs dual-layer Z-score normalization :
Initial Z-Score : (RSI² - SMA) / StDev
Final Z-Score : Z-score of the Z-score for refined extremity detection
This identifies statistically rare events relative to recent market behavior
4. Multi-Timeframe Confluence
Compares current timeframe Z-score with higher timeframe (HTF)
Provides directional confirmation across time horizons
Filters false signals through timeframe alignment
Why RoRD is Different & More Sophisticated
Beyond Traditional Indicators:
Acceleration vs. Velocity : While RSI measures momentum (velocity), RoRD measures momentum's rate of change (acceleration)
Adaptive Thresholds : Z-score analysis adapts to market conditions rather than using fixed 70/30 levels
Statistical Significance : Signals are based on mathematical rarity, not arbitrary levels
Leading Indicator : RSI² often turns before price, providing earlier signals
Reduced Whipsaws : T3 smoothing eliminates noise while maintaining responsiveness
Unique Signal Generation:
Quantum Orbs : Multi-layered visual signals for statistically extreme events
Divergence Detection : Automated identification of price/momentum divergences
Regime Backgrounds : Visual market state classification (Bullish/Bearish/Neutral)
Particle Effects : Dynamic visualization of momentum energy
Visual Design & Interpretation Guide
Color Coding System:
Yellow (#e1ff00) : Neutral/balanced momentum state
Red (#ff0000) : Overbought/extreme bullish acceleration
Green (#2fff00) : Oversold/extreme bearish acceleration
Orange : Z-score visualization
Blue : HTF Z-score comparison
Main Visual Elements:
RSI² Line with Glow Effect
Multi-layer glow creates depth and emphasis
Color dynamically shifts based on momentum state
Line thickness indicates signal strength
Quantum Signal Orbs
Green Orbs Below : Statistically rare oversold conditions
Red Orbs Above : Statistically rare overbought conditions
Multiple layers indicate signal strength
Only appear at Z-score extremes for high-conviction signals
Divergence Markers
Green Circles : Bullish divergence detected
Red Circles : Bearish divergence detected
Plotted at pivot points for precision
Background Regimes
Green Background : Bullish momentum regime
Grey Background : Bearish momentum regime
Blue Background : Neutral/transitioning regime
Particle Effects
Density indicates momentum energy
Color matches current RSI² state
Provides dynamic market "feel"
Dashboard Metrics - Deep Dive
RSI² ANALYSIS Section:
RSI² Value (0-100)
Current smoothed RSI of RSI reading
>70 : Strong bullish acceleration
<30 : Strong bearish acceleration
~50 : Neutral momentum state
RSI¹ Value
Traditional RSI for reference
Compare with RSI² for acceleration/deceleration insights
Z-Score Status
🔥 EXTREME HIGH : Z > threshold, statistically rare bullish
❄️ EXTREME LOW : Z < threshold, statistically rare bearish
📈 HIGH/📉 LOW : Elevated but not extreme
➡️ NEUTRAL : Normal statistical range
MOMENTUM Section:
Velocity Indicator
▲▲▲ : Strong positive acceleration
▼▼▼ : Strong negative acceleration
Shows rate of change in RSI²
Strength Bar
██████░░░░ : Visual power gauge
Filled bars indicate momentum strength
Based on deviation from center line
SIGNALS Section:
Divergence Status
🟢 BULLISH DIV : Price making lows, RSI² making highs
🔴 BEARISH DIV : Price making highs, RSI² making lows
⚪ NO DIVERGENCE : No divergence detected
HTF Comparison
🔥 HTF EXTREME : Higher timeframe confirms extremity
📊 HTF NORMAL : Higher timeframe is neutral
Critical for multi-timeframe confirmation
Trading Application & Strategy
Signal Hierarchy (Highest to Lowest Priority):
Quantum Orb + HTF Alignment + Divergence
Highest conviction reversal signal
Z-score extreme + timeframe confluence + divergence
Quantum Orb + HTF Alignment
Strong reversal signal
Wait for price confirmation
Divergence + Regime Change
Medium-term reversal signal
Monitor for orb confirmation
Threshold Crosses
Traditional overbought/oversold
Use as alert, not entry
Entry Strategies:
For Reversals:
Wait for Quantum Orb signal
Confirm with HTF Z-score direction
Enter on price structure break
Stop beyond recent extreme
For Continuations:
Trade with regime background color
Use RSI² pullbacks to center line
Avoid signals against HTF trend
For Scalping:
Focus on Z-score extremes
Quick entries on orb signals
Exit at center line cross
Risk Management:
Reduce position size when signals conflict with HTF
Avoid trades during regime transitions (blue background)
Tighten stops after divergence completion
Scale out at statistical mean reversion
Development & Uniqueness
RoRD represents months of research into momentum dynamics and statistical analysis. Unlike indicators that simply combine existing tools, RoRD introduces several genuine innovations :
True RSI² Implementation : Not a smoothed RSI, but actual RSI calculated on RSI values
Dual Z-Score Normalization : Unique approach to finding statistical extremes
T3 Integration : First RSI² implementation with T3 smoothing for optimal lag reduction
Quantum Orb Visualization : Revolutionary signal display method
Dynamic Regime Detection : Automatic market state classification
Statistical Adaptability : Thresholds adapt to market volatility
This indicator was built from first principles, with each component carefully selected for its mathematical properties and practical trading utility. The result is a professional-grade tool that provides insights unavailable through traditional momentum analysis.
Best Practices & Tips
Start with default settings - they're optimized for most markets
Always check HTF alignment before taking signals
Use divergences as early warning , orbs as confirmation
Respect regime backgrounds - trade with them, not against
Combine with price action - RoRD shows when, price shows where
Adjust Z-score thresholds based on market volatility
Monitor dashboard metrics for complete market context
Conclusion
RoRD isn't just another indicator—it's a complete momentum analysis system that reveals market dynamics invisible to traditional tools. By combining momentum acceleration, statistical analysis, and multi-timeframe confluence with intuitive visualization, RoRD provides traders with a sophisticated edge in any market condition.
Whether you're scalping rapid reversals or positioning for major trend changes, RoRD's unique approach to momentum analysis will transform how you see and trade market dynamics.
See momentum's future. Trade with statistical edge.
Trade with insight. Trade with anticipation.
— Dskyz, for DAFE Trading Systems

ES OHLC BASED ON 9:301. RTH Price Levels
YC (Yesterday's Close): Previous day's RTH closing price at 4:00 PM ET
0DTE-O (Today's Open): Current day's RTH opening price at 9:30 AM ET
T-E-M (Today's Europe-Asia Midpoint): Midpoint of overnight session high/low
T-E-R (Today's Europe-Asia Resistance): Overnight session high
T-E-S (Today's Europe-Asia Support): Overnight session low
Y-T-M (Yesterday-Today Midpoint): Midpoint between YC and 0DTE-O
2. Previous Bar Percentage Levels
Displays 50% retracement level for all bars
Shows 70% level for bullish bars (close > open)
Shows 30% level for bearish bars (close < open)
Lines automatically update with each new bar
3. Custom Support/Resistance Lines
Up to 4 customizable horizontal levels (2 resistance, 2 support)
Useful for marking key psychological levels or pivot points
4. VIX-Based Options Strategy Suggestions
Real-time VIX value display
Time Zone Handling
The indicator is configured for Central Time (CT) as Pine Script's default:
RTH Open: 8:30 AM CT (9:30 AM ET)
RTH Close: 3:00 PM CT (4:00 PM ET)
Overnight session: 7:00 PM CT to 8:30 AM CT next day
Usage Notes
Chart Requirement: This indicator only works on 5-minute timeframe charts
Auto-refresh: All lines and labels automatically refresh at each new trading day's RTH open
24-hour Market: Designed for ES futures which trade nearly 24 hours
Visual Clarity: Different line styles and colors for easy identification
Ideal For
Day traders focusing on ES futures
0DTE options traders needing key reference levels
Traders using overnight gaps and previous day's levels
Those incorporating VIX-based strategies in their trading

muraThis indicator is based on moving averages over a certain period using Fibonacci numbers. Pivot points are provided for active trading, which help to trade from the levels.
The indicator takes into account the trend direction, identifies key levels and possible targets.
You can also easily set up notifications for trend changes and receive them in the tradingview app or as an audio signal on your computer. This will help you not to miss anything in the market.
The moving averages with a uniquely recognized trend. 6 moving averages create 3 important trends. The first trend is local from your time frame, the second is global from your time frame and the third trend is predicated for tracking the global trend on an older time frame.
I have identified ways to trade my indicator:
- On a 4-hour time frame you can open trades in one direction with a change in the global trend. That is, if the red trend changes to green, it is time to open longs and vice versa.
- The global trend works best when paired with the local trend. That is, if the global trend is green, we wait until the local trend becomes green and then open longs, as well as in the opposite direction.
- Opening positions when the local trend changes towards the global trend also works well on a 12 hour time frame.
This indicator can be used on any timeframes from 1 minute to 1 year. You can also select levels for trading:
- intraday
- intra-week
- within a month
Note:
- Before you start trading, I strongly recommend you to do your own analysis on your own time frame or pairs
- Recommended for use with additional technical analysis tools
